Reading the music world
Charts & World Pulse
RockMundo uses several chart views because different questions need different answers. Streams, physical sales, digital sales, geography, time period and seasonal moments can all tell different stories, while World Pulse gives broader context about what is moving across the world.
In brief
Start by checking what the chart actually measures. Then compare the period, territory and format with your streams, sales, promotion, live activity and fan movement. Similar-looking charts are not duplicates if they measure different slices of the market.
Why there are several chart types
Combined charts
Combine eligible commercial signals to show a broader picture of release performance.
Streaming charts
Focus on listening activity and ongoing digital discovery rather than physical purchasing.
Sales / format charts
Show how specific release formats are performing, which can differ sharply from streaming behaviour.
Country charts
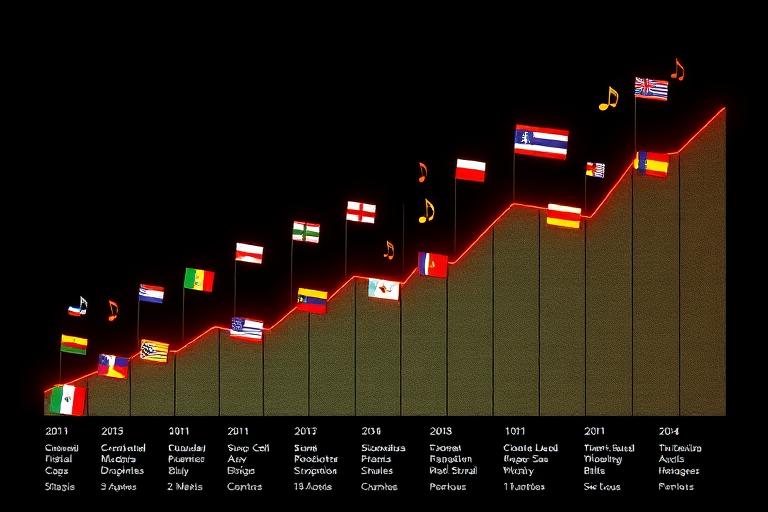
Reveal where an artist's audience is strongest and where a campaign may be beginning to break through.
Time-period charts
Daily, weekly, monthly and longer views separate a short spike from sustained success.
Seasonal charts
Special moments such as the Christmas Number 1 are tied to the world calendar and are intended to feel distinct from a normal weekly refresh.
What World Pulse adds

World Pulse aggregates audience activity so players can see what the wider world is responding to. It is useful for identifying momentum, comparing periods and understanding that your release exists inside a living economy rather than in isolation.
Use it as context around the underlying streams, sales and audience activity. A strong pulse does not guarantee a specific chart position, and a quiet day does not mean a release is permanently weak.
How to read a chart result
- Start with the metric. Identify whether the chart is combined, streaming, physical, digital or another defined measure.
- Check geography. A release can be strong in one country while still building elsewhere.
- Check the period. A daily spike and a sustained weekly or monthly position mean different things.
- Compare career activity. Look at gigs, promotion, release campaigns and fan growth around the same dates.
- Watch direction, not only rank. Movement over time often explains more than a single isolated position.
Streams and record sales are not interchangeable
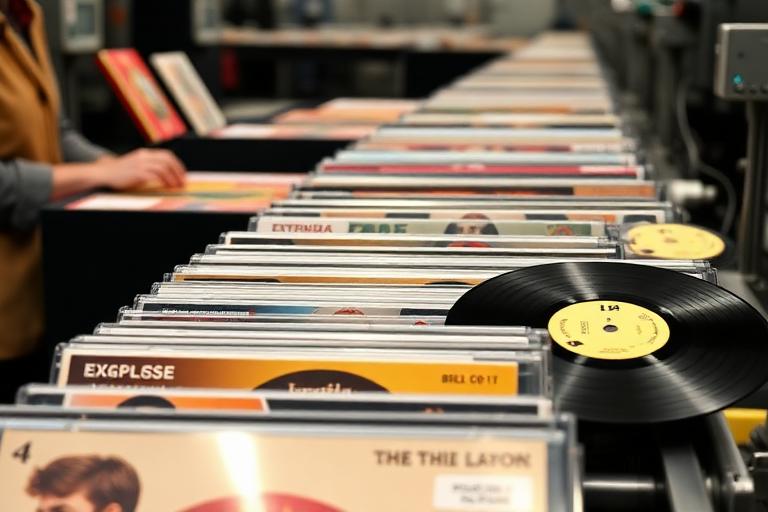
A release can have a very different profile across formats. Compare the underlying signals before deciding whether a campaign is succeeding or failing.
Christmas Number 1
The Christmas Number 1 is a special seasonal race rather than just another historical chart row. During the run-up to Christmas, the world can surface additional chart feedback and themed events so players know the seasonal competition is approaching.
- Watch the seasonal chart during the run-up rather than only checking on the final day.
- Use release, promotion and live activity as part of the campaign rather than treating the chart as a separate grind.
- Final winners are retained as part of chart history so past Christmas Number 1 results remain meaningful.
- Do not assume a standard weekly chart position automatically equals the seasonal result; use the dedicated seasonal context.
What should I do with chart information?
- Use strong regional performance to inform future gig and promotion choices.
- Compare format demand before committing to another physical production run.
- Do not abandon a release solely because its first chart day is weak.
- Look for sustained movement after media coverage, tour dates, social activity or label campaigns.
- Use rankings as feedback, not as a replacement for building the underlying career.